Introduction to Observability in Kubernetes: Setting Up Metrics and Traces with OpenTelemetry
Kubernetes has become the leading platform for managing containerized applications at scale, especially for distributed applications. However, managing and monitoring these applications can be challenging due to their complex, dynamic nature. This is where observability comes in.
Observability enables teams to gain deep insights into the internal state of their systems, helping them monitor the overall health and performance of applications. In this blog, we will explore how to set up an observability pipeline for applications running on Kubernetes, leveraging OpenTelemetry to collect metrics, logs, and distributed traces. This pipeline will help you monitor your application’s performance and troubleshoot issues efficiently, providing visibility into critical aspects of your Kubernetes workloads.
How to Set Up OpenTelemetry in Kubernetes: The Complete Observability Pipeline
In this section, we’ll walk through the full setup of an observability pipeline using OpenTelemetry within a Kubernetes environment. As shown in the diagram above, the pipeline consists of four key components:
Application: The app will export telemetry data (metrics, logs, and traces) using OTLP (OpenTelemetry Protocol) over gRPC, which is the recommended method for efficient data transmission.
OpenTelemetry Collector: The OpenTelemetry Collector acts as an intermediary, receiving telemetry data from the application, processing it, and exporting it to the appropriate backends. The collector is capable of handling multiple types of data in parallel.
Backends: In this pipeline, we will integrate two main backends:
- Prometheus for collecting metrics such as CPU usage, memory utilization, and request rate.
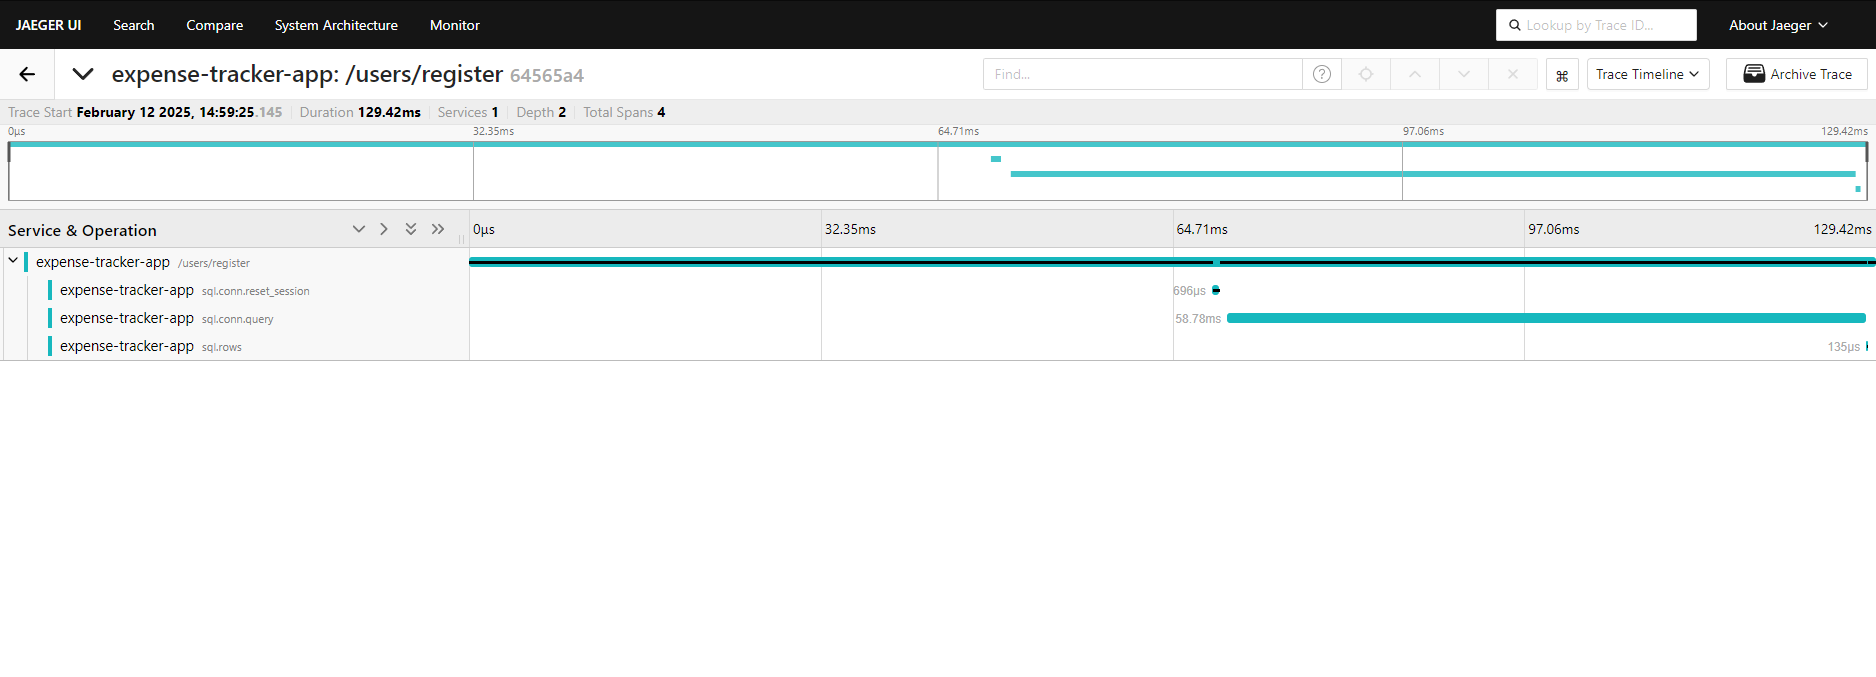
- Jaeger for capturing distributed traces, enabling you to visualize the flow of requests across different services within the application.
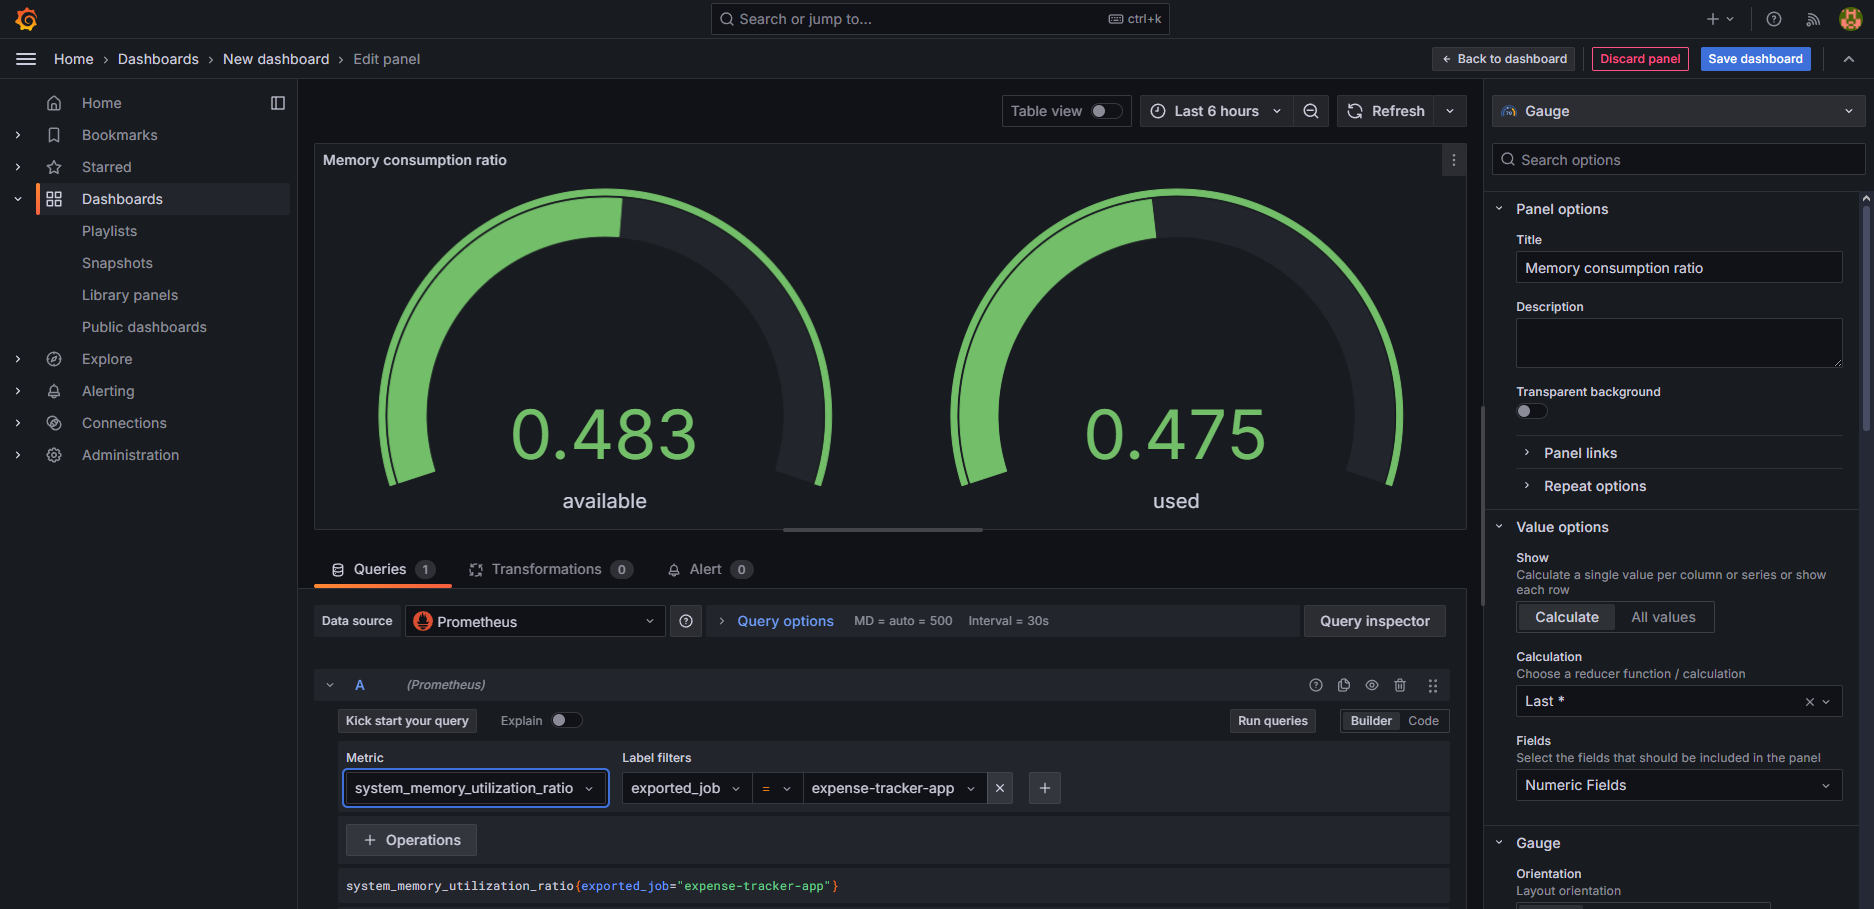
Grafana: Finally, we will use Grafana to visualize the metrics collected by Prometheus. Grafana allows you to create interactive dashboards for real-time monitoring, giving you insights into your application’s performance and health.
Deploying the OpenTelemetry Collector in Kubernetes for Metrics and Tracing
To deploy the OpenTelemetry Collector in Kubernetes, we will use the Helm chart provided by the OpenTelemetry project. You can find the official documentation and more details here.
For our setup, we will override the default configuration by creating a values.yaml file. This configuration will allow us to tailor the OpenTelemetry Collector deployment to our needs, enabling both metrics and distributed tracing.
Here is the values.yaml configuration we will use to deploy the OpenTelemetry Collector:
You can view the complete configuration file here.
In the values.yaml file, we define key configurations that control the deployment and behavior of the OpenTelemetry Collector in Kubernetes. Let’s break down the key parts:
1. Image Configuration
image:
  repository: "otel/opentelemetry-collector-contrib"
  pullPolicy: IfNotPresent
  tag: "0.118.0"
In this section, we specify the image that will be used for deploying the OpenTelemetry Collector.
Repository: We use the otel/opentelemetry-collector-contrib image, which includes additional exporters, such as the Prometheus exporter, that are not present in the base otel/opentelemetry-collector-k8s image. This makes it the right choice for our setup since we need Prometheus to collect metrics.
PullPolicy: We set it to IfNotPresent, meaning the image will only be pulled if it’s not already present on the node.
Tag: The tag 0.118.0 specifies the version of the OpenTelemetry Collector image. This version is compatible with the configurations and exporters we need.
2. Deployment Mode
mode: "deployment"
Here, we set the mode to deployment. This configuration tells Kubernetes to deploy the OpenTelemetry Collector as a Deployment resource, which is a standard practice for running containerized applications in Kubernetes, also it provides the Gateway deployment for the collector.
For more information about different OpenTelemetry Collector deployment modes, you can check the official deployment documentation.
3. Command to Run the Collector
command:
  name: "otelcol-contrib"
In this section, we specify the command to initialize the OpenTelemetry Collector. The otelcol-contrib command ensures that the collector runs with the configuration settings from the contributed image (which includes additional exporters and features).
By setting the command to otelcol-contrib, we ensure that the OpenTelemetry Collector will start properly with the desired configuration, allowing it to receive, process, and export telemetry data.
4. Exporters
exporters:
  debug: {}
  prometheus:
    endpoint: ${env:MY_POD_IP}:8889
  otlp/jaeger:
    endpoint: jaeger-collector:4317
    tls:
      insecure: true
Debug Exporter: This exporter is used for debugging purposes. It allows the collector to output telemetry data in a simple, human-readable format for diagnostic use.
Prometheus Exporter: The collector will send telemetry data to Prometheus at the endpoint :${env:MY_POD_IP}:8889. This allows Prometheus to scrape the telemetry data for metrics collection.
Jaeger Exporter (OTLP): This exporter sends tracing data to the Jaeger collector at jaeger-collector:4317. The tls section with insecure: true disables TLS encryption for the connection to Jaeger, which is often used in testing or non-production environments.
By defining these exporters, the collector is instructed to send data to multiple destinations, such as Prometheus for metrics and Jaeger for traces.
5. Processors
processors:
  batch: {}
  memory_limiter:
    check_interval: 5s
    limit_percentage: 80
    spike_limit_percentage: 25
Batch Processor: This processor groups telemetry data into batches for more efficient processing. This helps in reducing the number of network requests or system I/O operations.
Memory Limiter Processor: This processor is essential for managing the collector’s memory consumption.
- check_interval: It checks the memory usage every 5 seconds.
- limit_percentage: This configuration ensures that the collector’s memory usage will not exceed 80% of the available memory.
- spike_limit_percentage: In case of sudden memory spikes, it limits the usage to 25% of the available memory.
This memory limitation prevents the OpenTelemetry Collector from using excessive resources and ensures it remains responsive within the Kubernetes cluster.
6. Receivers
receivers:
  jaeger:
    protocols:
      grpc:
        endpoint: ${env:MY_POD_IP}:14250
      thrift_http:
        endpoint: ${env:MY_POD_IP}:14268
      thrift_compact:
        endpoint: ${env:MY_POD_IP}:6831
  otlp:
    protocols:
      grpc:
        endpoint: ${env:MY_POD_IP}:4317
      http:
        endpoint: ${env:MY_POD_IP}:4318
  prometheus:
    config:
      scrape_configs:
        - job_name: opentelemetry-collector
          scrape_interval: 10s
          static_configs:
            - targets:
                - ${env:MY_POD_IP}:8888
  zipkin:
    endpoint: ${env:MY_POD_IP}:9411
Receivers define the data sources from which the collector can receive telemetry data. In this configuration, we define the following:
Jaeger Receiver: The collector can receive tracing data from Jaeger over three different protocols: grpc, thrift_http, and thrift_compact, with each protocol listening on specific endpoints.
OTLP Receiver: The collector can receive data using the OpenTelemetry Protocol (OTLP) over both gRPC and HTTP on the specified endpoints. This is used to receive telemetry data from other OpenTelemetry-compliant systems.
Prometheus Receiver: The collector scrapes Prometheus-formatted metrics from the specified target :${env:MY_POD_IP}:8888 every 10 seconds.
Zipkin Receiver: The collector can receive trace data from Zipkin at the specified endpoint.
These receivers ensure that the OpenTelemetry Collector can accept telemetry data from multiple sources and protocols.
7. Pipelines
pipelines:
  logs:
    exporters:
      - debug
    processors:
      - memory_limiter
      - batch
    receivers:
      - otlp
  metrics:
    receivers:
      - otlp
    processors:
      - memory_limiter
      - batch
    exporters:
      - prometheus
      - debug
  traces:
    receivers:
      - otlp
    processors:
      - memory_limiter
      - batch
    exporters:
      - debug
      - otlp/jaeger
Pipelines are the heart of the OpenTelemetry Collector’s processing logic. Each pipeline defines a series of steps that data will go through, starting from receiving telemetry data to processing it and finally exporting it to the appropriate destination.
Logs Pipeline:
- Receivers: It receives logs from the OTLP receiver.
- Processors: The data is processed using the memory_limiter and batch processors.
- Exporters: The processed logs are exported to the debug exporter for debugging purposes.
Metrics Pipeline:
- Receivers: The pipeline receives metrics data via OTLP.
- Processors: It processes data using memory_limiter and batch.
- Exporters: The processed metrics are sent to Prometheus for scraping and monitoring, and also to the debug exporter.
Traces Pipeline:
- Receivers: It receives tracing data via OTLP.
- Processors: It uses memory_limiter and batch to process the data.
- Exporters: The traces are exported to Jaeger via the OTLP/jaeger exporter, as well as the debug exporter for debugging.
Each pipeline is tailored to handle specific types of telemetry data: logs, metrics, or traces. This allows the OpenTelemetry Collector to process and export different telemetry types in an efficient and manageable way.
8. Ports Configuration
ports:
  jaeger-compact:
    enabled: false
  jaeger-thrift:
    enabled: false
  metrics:
    enabled: true
    containerPort: 8889
    servicePort: 8889
    protocol: TCP
This section defines the ports that the OpenTelemetry Collector will expose and whether they are enabled or not. It provides a way to control which ports are available for accepting incoming requests.
9. Service Monitor Configuration
serviceMonitor:
  enabled: true

  extraLabels:
    release: prometheus-demo
This section enables the creation of a ServiceMonitor. A ServiceMonitor is a custom resource definition (CRD) in Kubernetes that Prometheus uses to discover and scrape metrics from services.
enabled: true: This enables the creation of a ServiceMonitor resource. When enabled, the OpenTelemetry Collector will expose metrics that Prometheus can scrape.
extraLabels: Here, you define extra labels to be added to the ServiceMonitor. These labels help Prometheus identify and monitor this specific service.
release: prometheus-demo: This label ties the ServiceMonitor to a specific Prometheus release. The label release: prometheus-demo tells Prometheus to consider this service as part of the prometheus-demo release for monitoring purposes.
Important: The value of the release label should match the name of the Prometheus release you’re using. If you’re using a different release name (e.g., my-prometheus-release), you will need to change this label to match that name.
By using the ServiceMonitor, the OpenTelemetry Collector is automatically integrated with Prometheus, and Prometheus will scrape the defined metrics from the service, allowing for better monitoring and observability.
Deploying the OpenTelemetry Collector
Once you’ve finalized your values.yaml configuration, you can deploy the OpenTelemetry Collector to your Kubernetes cluster with the following Helm command:
helm install my-opentelemetry-collector open-telemetry/opentelemetry-collector -f values.yaml
Verify the Deployment:
After deploying the OpenTelemetry Collector, it’s essential to check if the collector is running properly in your Kubernetes environment.
To check if all pods are running:
kubectl get pods -n <your-namespace>
To check if the services are up and accessible:
kubectl get services -n <your-namespace>
Integrating Prometheus for Real-Time Metrics Collection in Kubernetes
To deploy Prometheus into the cluster and integrate it with the OpenTelemetry Collector, we can achieve this using the following steps.
Step 1: Ensure Helm is Installed
First, it is important to have Helm installed. If it is not installed, you can install it by following the official documentation.
Step 2: Add the Prometheus Helm Chart Repository
The kube-prometheus-stack chart is available on GitHub at:
🔗 kube-prometheus-stack GitHub Repository
To add the chart to the Helm client, run:
helm repo add prometheus-community https://prometheus-community.github.io/helm-charts
helm repo update
These commands add the chart repository and update the Helm client to fetch the latest charts.
Step 3: Deploy Prometheus into the Cluster
To install all necessary resources in the cluster, use the following command:
helm install prometheus-demo prometheus-community/kube-prometheus-stack
Note: The release name must match the one defined in the OpenTelemetry Collector configuration. In this case, we use prometheus-demo because it was specified in the serviceMonitor configuration as:
serviceMonitor:
  enabled: true
  extraLabels:
    release: prometheus-demo
If you change the release name, make sure to update this value accordingly.
Step 4: Verify the Deployment
After installation, check if all components are running correctly:
kubectl get pods -n <namespace>
kubectl get services -n <namespace>
With this setup, Prometheus and Grafana are ready to start collecting and visualizing metrics.
Setting Up Jaeger for Distributed Tracing in Kubernetes with OpenTelemetry
To set up Jaeger in Kubernetes, we will use Helm to install it via the official Helm chart. The chart is available at:
🔗 Jaeger Helm Chart Repository
Choosing the Right Deployment Option
The Helm chart provides multiple ways to deploy Jaeger, including:
- Cassandra as storage – Not recommended
- Elasticsearch as storage – Recommended for production
- All-in-One mode – Recommended for demos and testing
For this demo project, we will use the All-in-One deployment. In a production environment, this is not recommended. Refer to the README in the repository for more details on production setups.
Configuring Jaeger (values.yaml)
To deploy Jaeger in All-in-One mode, use the following values.yaml file:
provisionDataStore:
  cassandra: false
allInOne:
  enabled: true
storage:
  type: memory
agent:
  enabled: false
collector:
  enabled: false
query:
  enabled: false
Deploying Jaeger
Once the values.yaml file is ready, deploy Jaeger using Helm:
helm install jaeger jaegertracing/jaeger --values values.yaml
Verifying the Deployment
After installation, ensure everything is running correctly with:
kubectl get pods
kubectl get services
At this point, Jaeger should be fully set up and ready for use.
Visualizing Metrics in Grafana and Traces in Jaeger UI
Viewing Distributed Traces in Jaeger
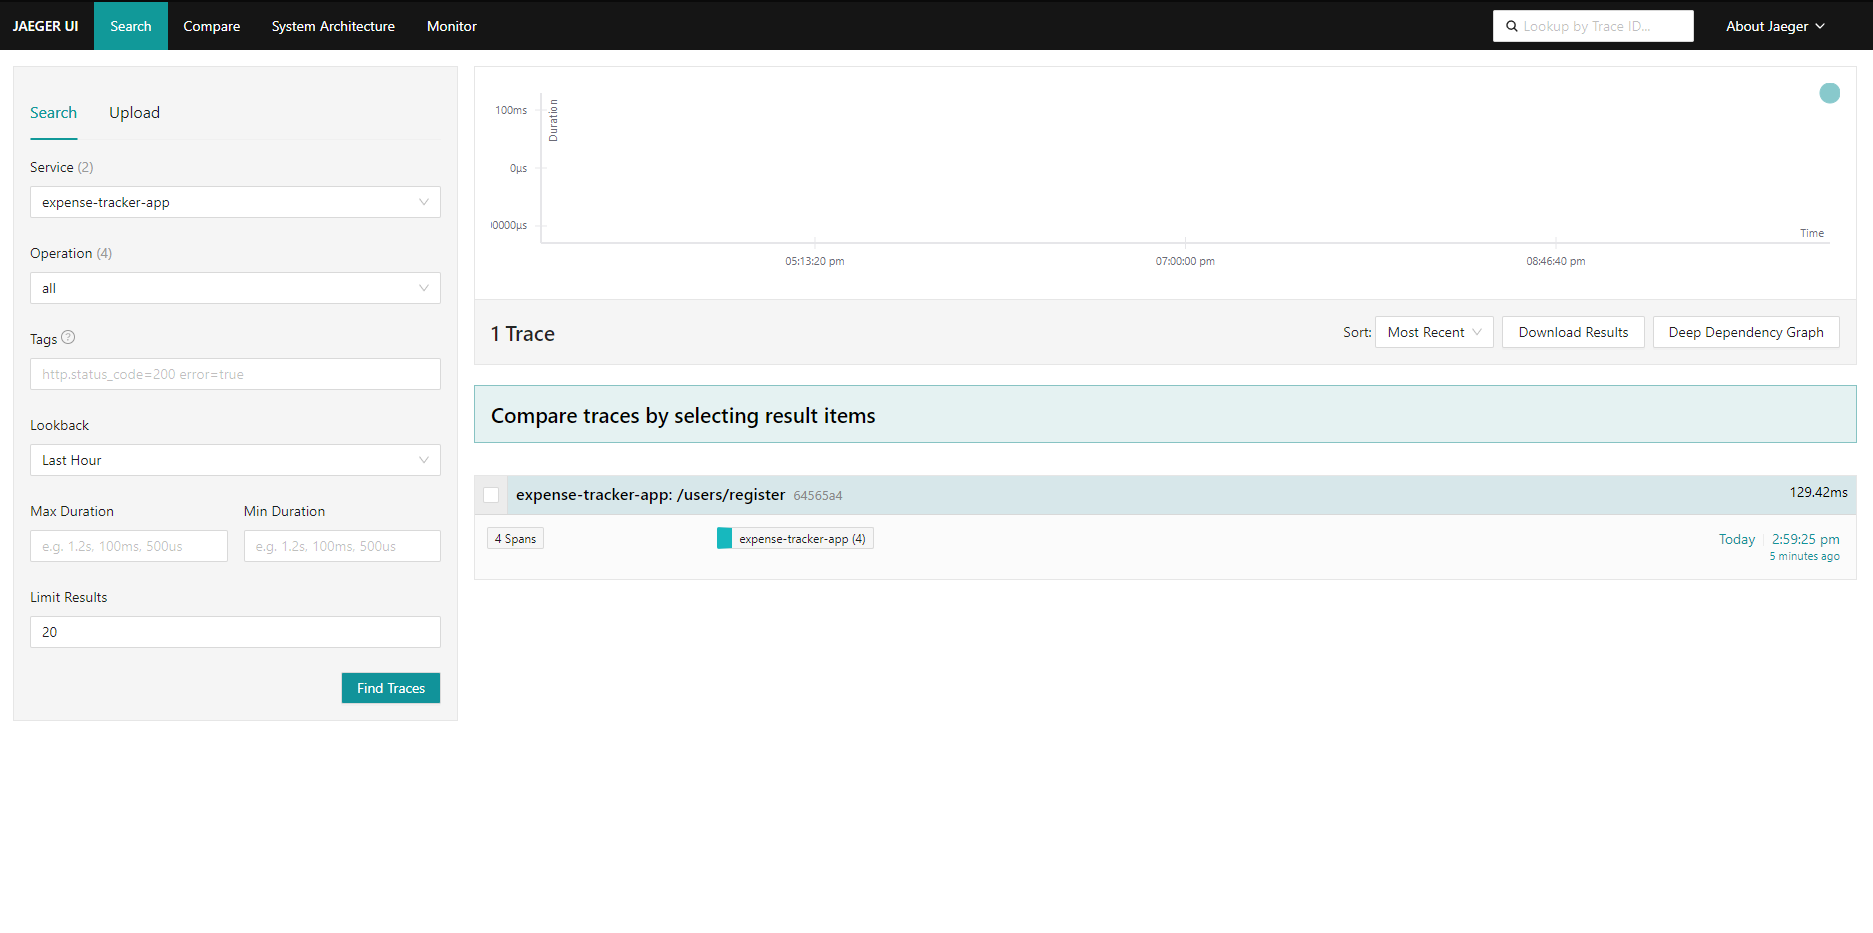
To visualize distributed traces in Jaeger, we need to port-forward the service and access the Jaeger UI in a browser.
Steps to Access Jaeger UI:
- Run the following command to forward port 16686:
kubectl port-forward svc/jaeger-query 16686:16686 - Open a web browser and navigate to:
http://localhost:16686 - In the Jaeger UI, you will see a dropdown where you can select a service.
- In this example, the service is Expense Tracker, as that is the running application.
- Click Search to view the collected traces.

Once you perform a search, Jaeger will display the traces captured for your application.

Visualizing Metrics in Grafana
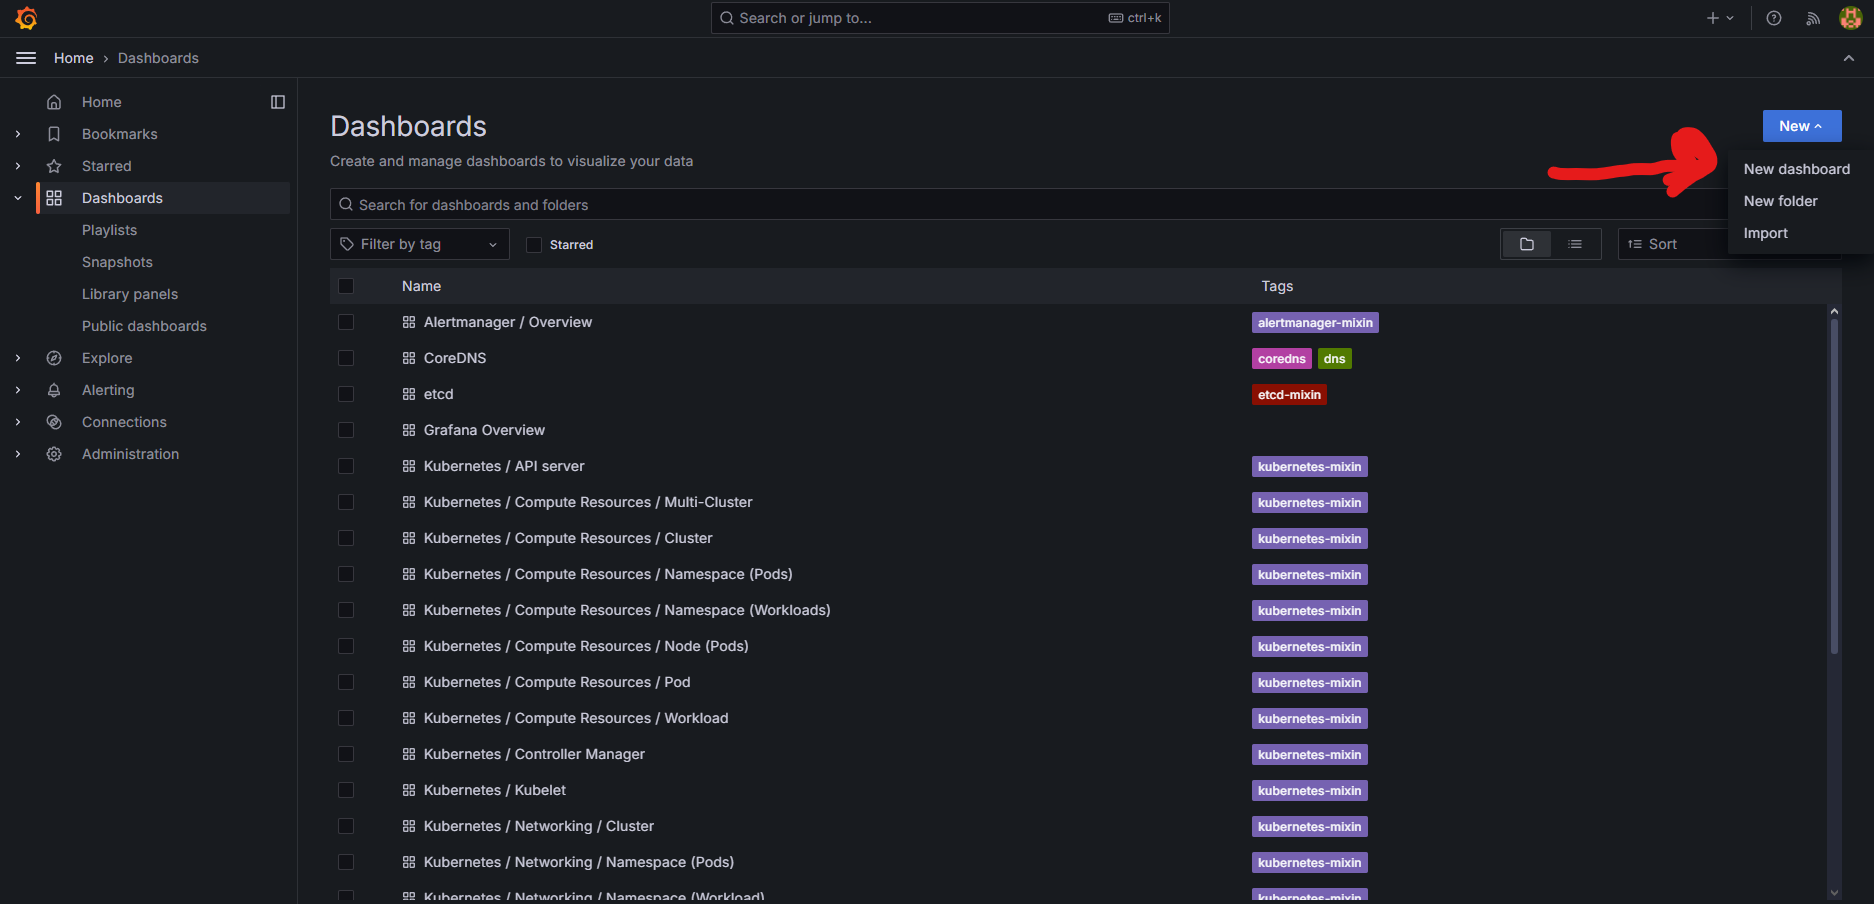
To access Grafana, we need to port-forward the service and log in to the UI.
Steps to Access Grafana UI:
- Run the following command to forward port 3000:
kubectl port-forward svc/prometheus-demo-grafana 3000:3000 - Open a web browser and navigate to:
http://localhost:3000 - Log in to Grafana:
- If you don’t know the credentials, you can retrieve them by decoding the Kubernetes secret with the following command:
kubectl get secret prometheus-demo-grafana -o jsonpath="{.data.admin-password}" | base64 --decode - The default username is: admin
- If you don’t know the credentials, you can retrieve them by decoding the Kubernetes secret with the following command:
Creating a Dashboard in Grafana
Once logged in, you can start creating a new dashboard:

- Use PromQL or the UI-based query editor to create custom visualizations for your application’s metrics.

By following this setup, we have successfully integrated Prometheus, Jaeger, and Grafana into our Kubernetes environment. Prometheus is now collecting real-time metrics, Jaeger is capturing distributed traces, and Grafana provides a user-friendly interface to visualize this data. With these tools in place, we can monitor application performance, analyze service interactions, and gain valuable insights into system behavior, all in real-time. This setup ensures better observability, aiding in debugging, performance optimization, and maintaining system reliability.
Conclusion
In this blog, we explored how to set up observability in a Kubernetes environment by integrating Prometheus, Jaeger, and Grafana with OpenTelemetry. We began by deploying an OpenTelemetry Collector to gather and export telemetry data, followed by configuring Prometheus for real-time metrics collection. Then, we set up Jaeger to track distributed traces, allowing us to monitor and analyze service interactions. Finally, we visualized the collected metrics and traces using Grafana and Jaeger UI.
This setup provides a foundation for an observability pipeline in a Kubernetes cluster, enabling us to leverage the full potential of OpenTelemetry. While this is just a demo project, it serves as a solid starting point for understanding key OpenTelemetry concepts. From here, more advanced observability systems can be built to suit production needs.
I hope you found this guide helpful! If you have any questions or recommendations, feel free to reach out via email.

